Every developer has encountered situations where they are unsure why a lambda function, or any Python code for that matter, is taking too long to run. To optimize the code, one must find the bottleneck first. It could get tedious to do so when the script is loaded with classes and methods.
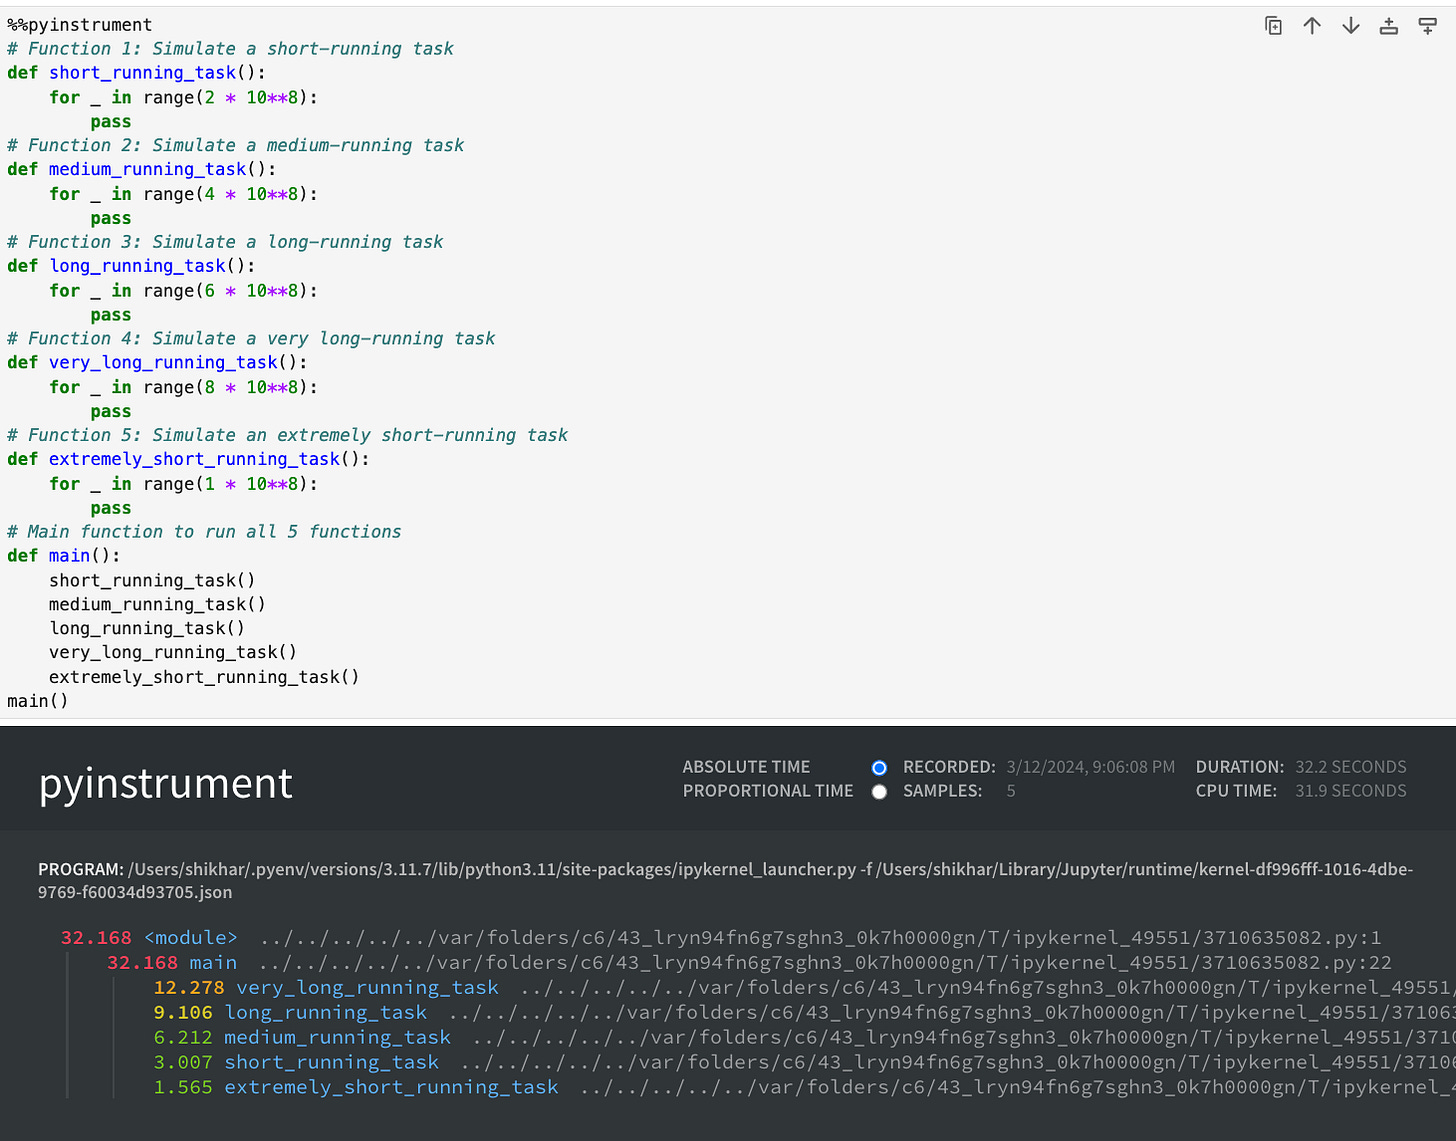
I’ve found Pyinstrument to be quite useful for profiling Python code. It lists all the methods run in the script in a nested fashion and how long each block takes to run. The profile is colour-coded and easy to interpret.
To create a profile, all you have to do is run the script using the pyinstrument pip package -
> pyinstrument timing.pyWith the above output, one can easily determine the code blocks needing optimizations. The best part about this tool is that it can be used with jupyter notebook as well using IPython magics. I used the same script in a notebook -
In conclusion, Pyinstrument is a neat and easy-to-use tool for profiling your Python code. I use it on a regular basis to identify tight spots in Python-based lambda functions to ensure the smooth running of production :) Another tool which provides line-by-line profiling is Py-heat. Check it out if you are interested in something like that.


